Imagine your React application running smoothly in production. You tested every feature, checked for bugs, and shipped something you are proud of. Then an unforeseen error creeps in.
A user hits a cryptic error screen. Frustrated, they contact support with a vague description - no screenshot, no context, no reproduction steps. Diagnosing it becomes a long, guessy afternoon. And that is the good case. The bad case is that they never report it at all, and a problem quietly frustrates people for weeks while your dashboards stay green.
You do not have to work that way.
Why error logging earns its keep
Detect issues before users report them. Instant visibility instead of waiting for a support ticket.
Find the root cause in seconds. Precise location, browser, device and the state the app was in.
Cut debugging time. What took hours becomes minutes when you have the context up front.
Improve proactively. Trends across events reveal bugs no single report would surface.
What Honeycomb is
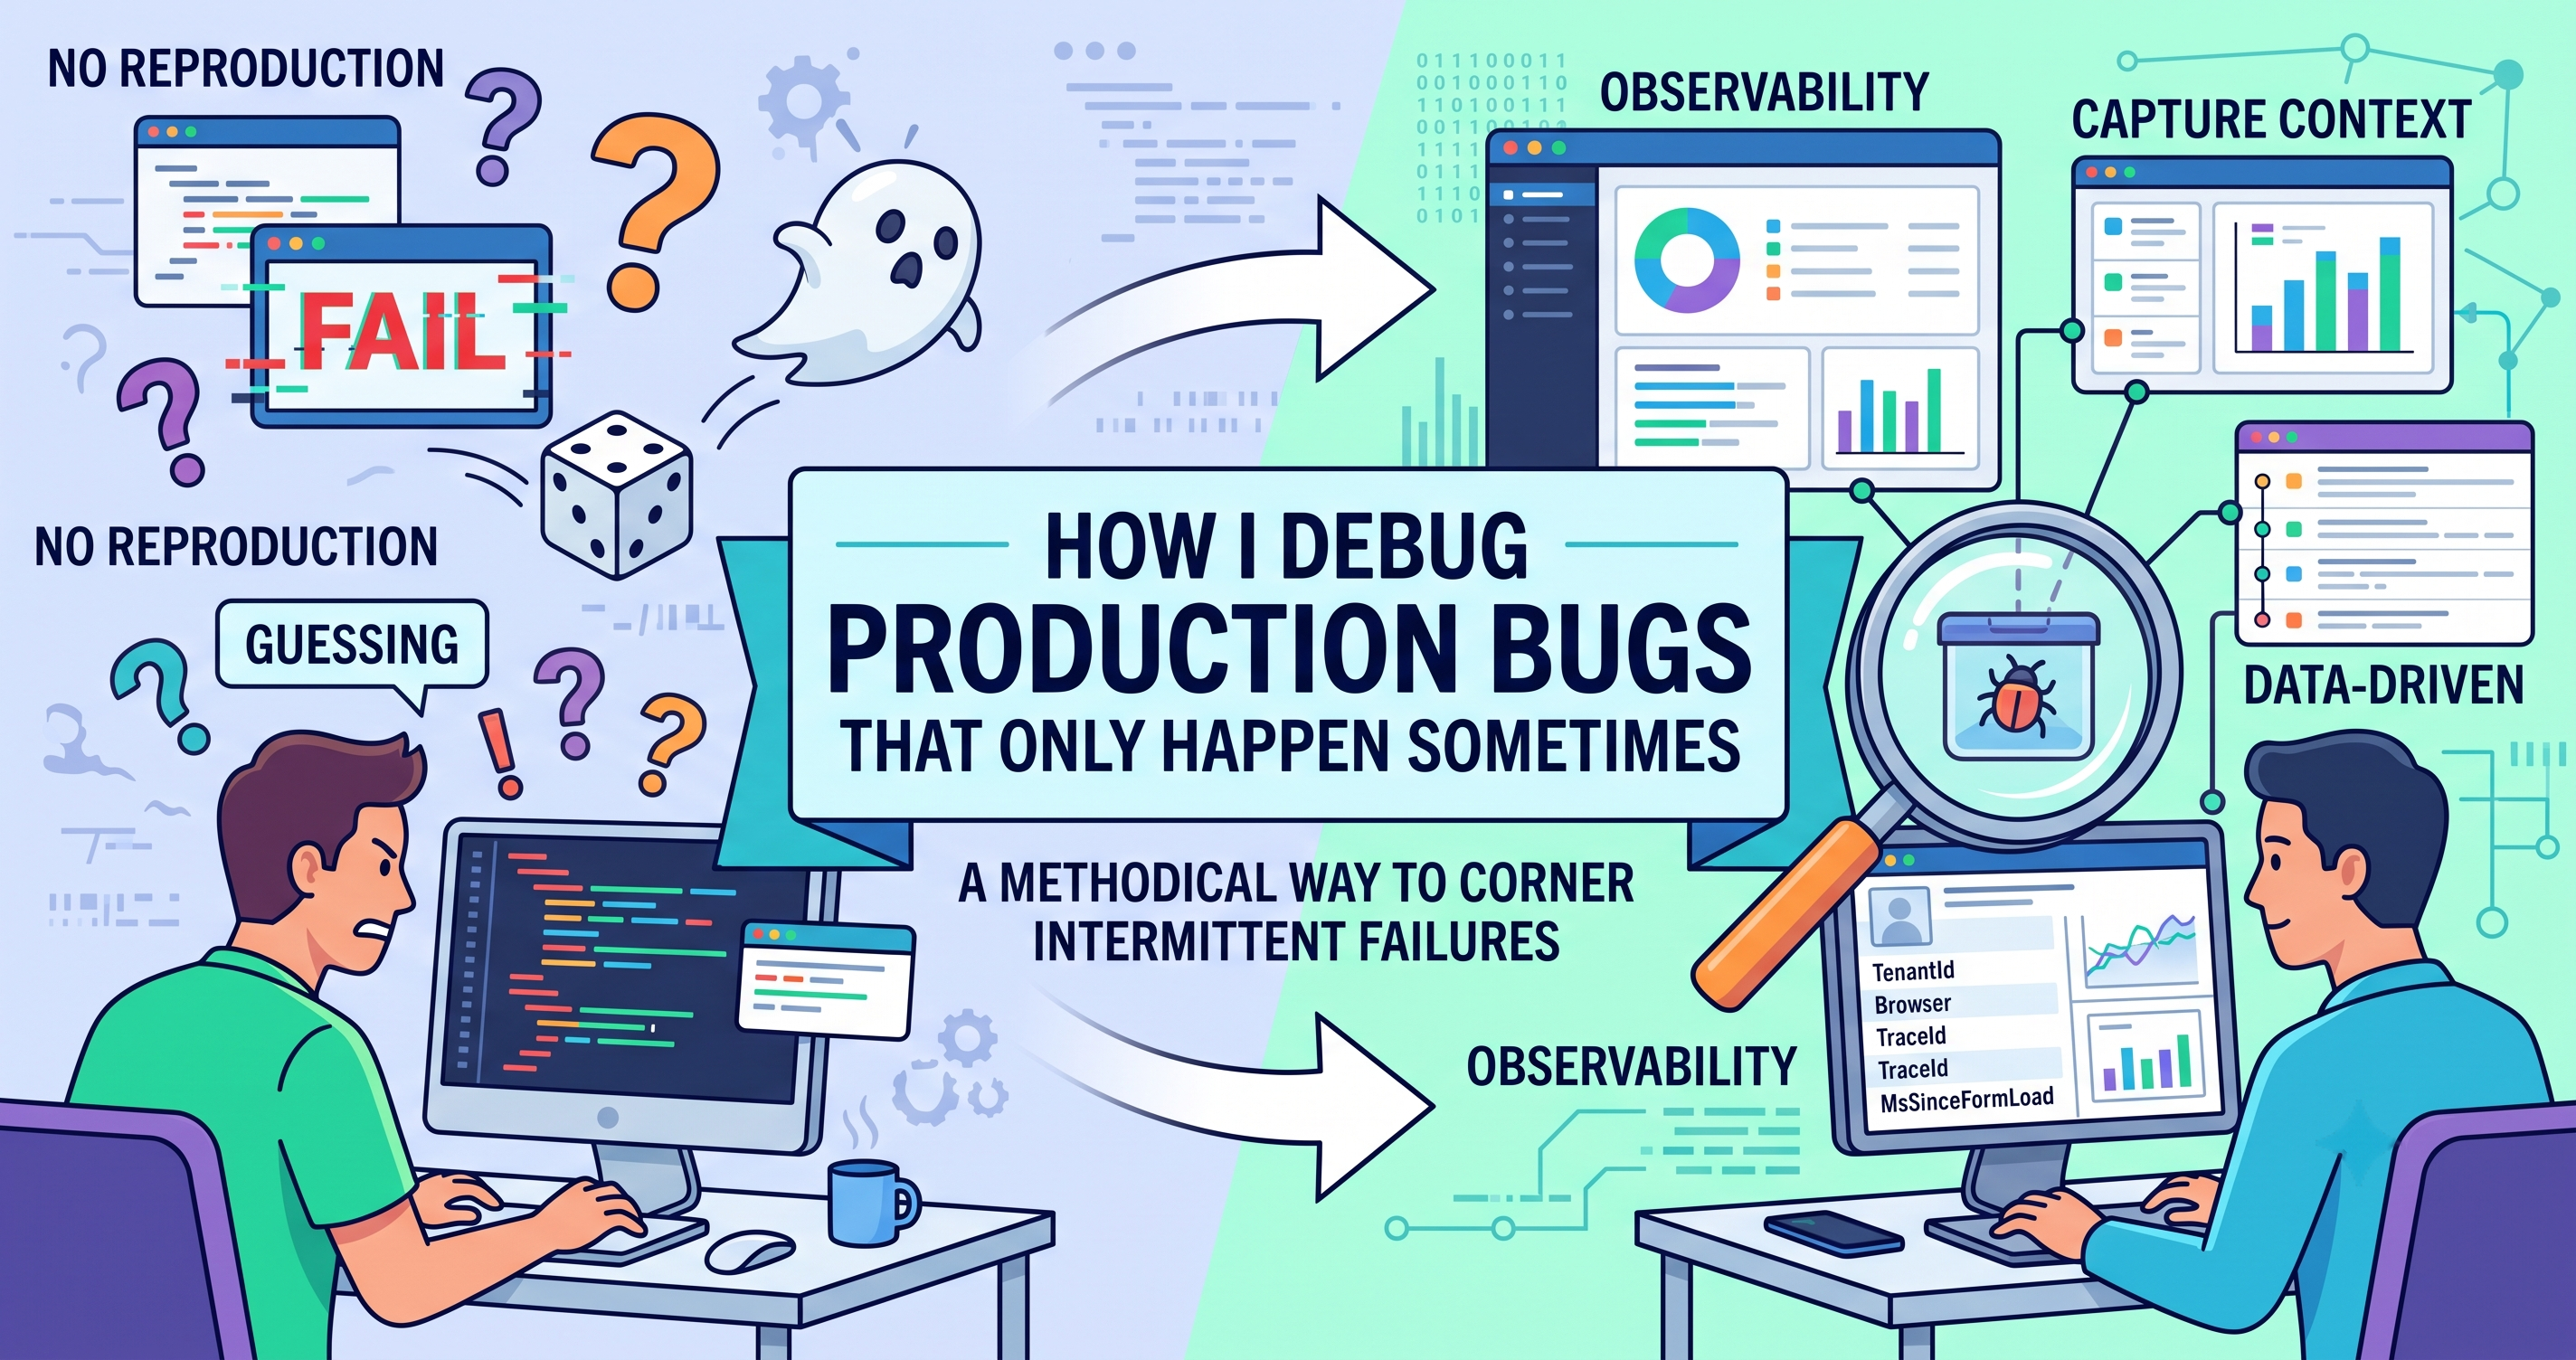
Honeycomb is an observability platform built around high-cardinality event data. Where a traditional logger gives you lines of text, Honeycomb gives you structured events you can slice by any field you attached - browser, device, user segment, trace ID, release.
Tools like Sentry and LogRocket cover similar ground and are excellent. Honeycomb stands out for being genuinely developer-friendly, generous on its free tier, and unusually good at answering questions you did not anticipate when you instrumented the code.
What we are building
Initialising Honeycomb - creating an environment and getting the API key that events will be sent with.
Integrating with React - an error boundary plus global handlers that capture and enrich every failure.
Configuring alerts - triggers that email you when something crosses a threshold you care about.
Step 1 - Initialise Honeycomb
1.1 Create an account
Sign up at honeycomb.io, or log in if you already have one.
1.2 Set up your environment
After signing up and creating a team, Honeycomb automatically creates a test environment for you and drops you on a setup page showing your API key. Copy it - you will need it in a moment.
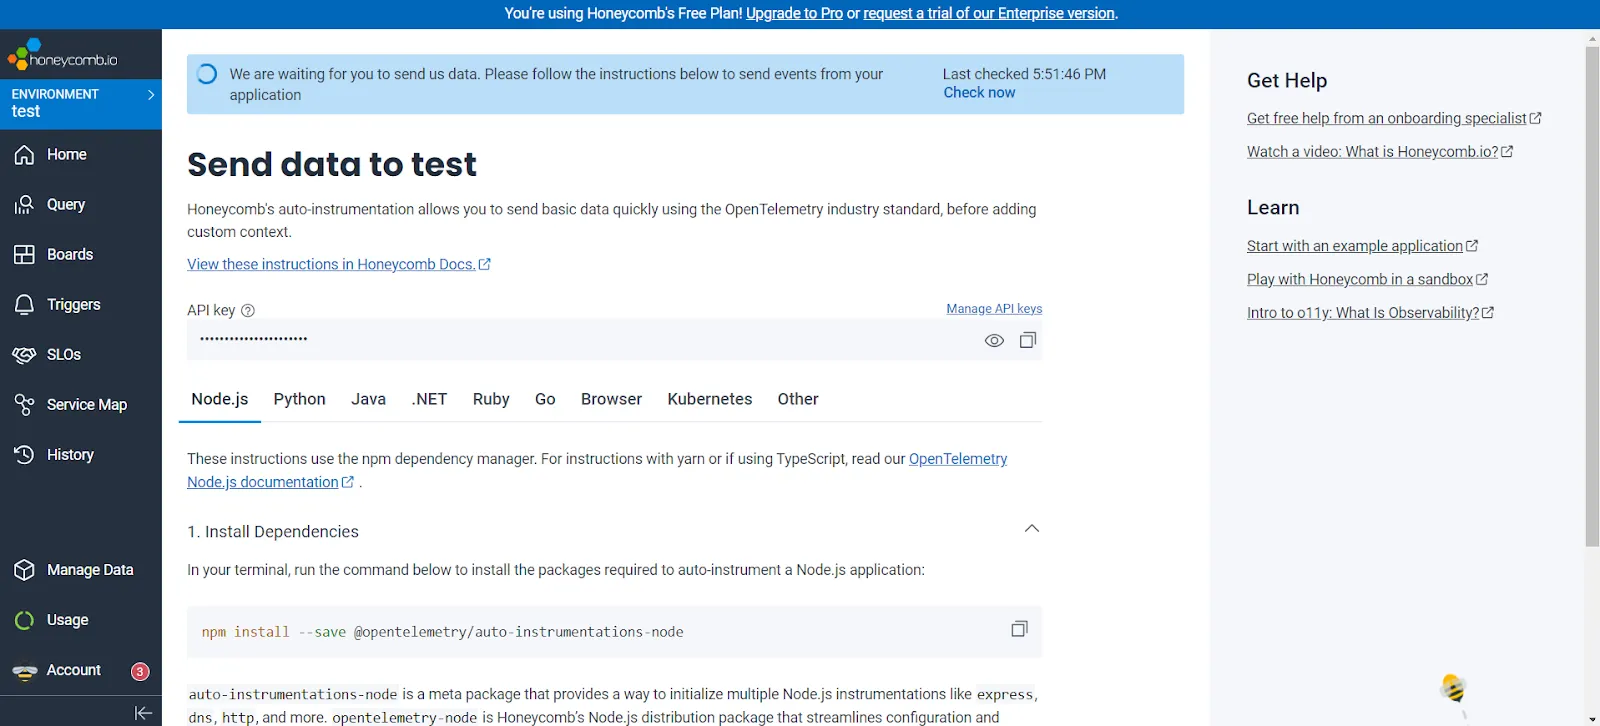
If you already have an account and want a fresh environment:
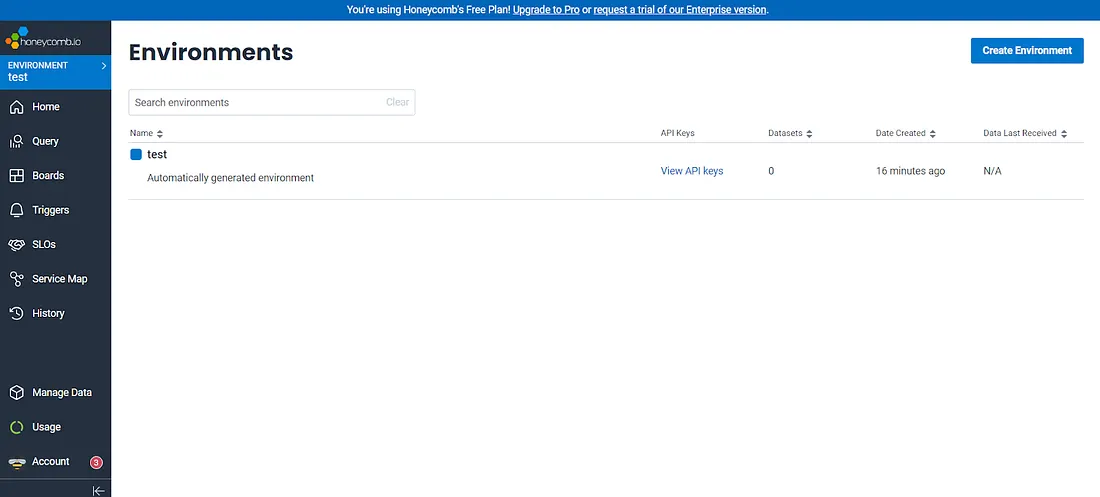
- Open Environment → Manage Environments from the top-left menu
- Click Create Environment
- The new environment's API key appears on the same page once it is created
1.3 Find the key for an existing environment
Go to Manage Environments and select the environment you want - its API key is listed in the details.
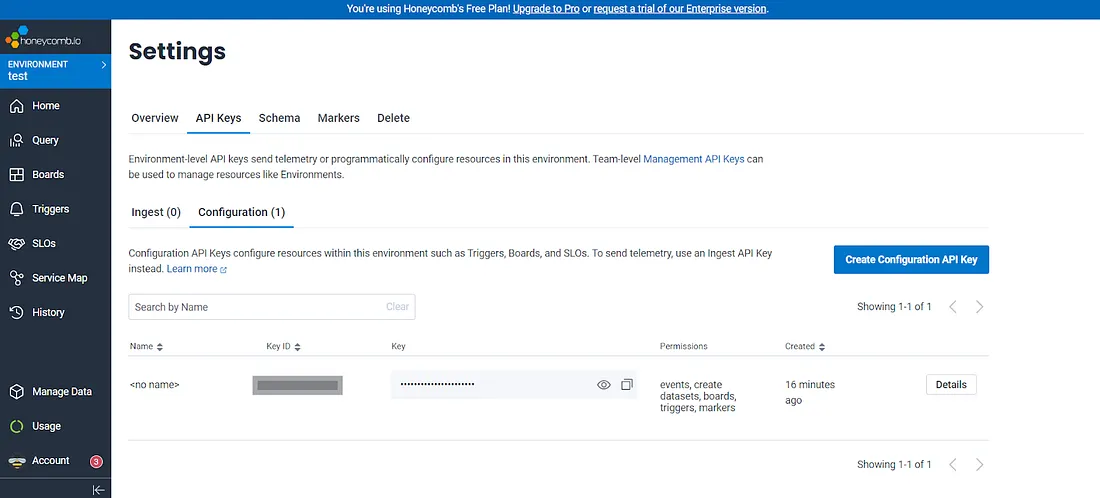
Anything in a browser bundle is public, but committing the key to source control is still avoidable. Put it in an environment variable at build time and use an ingest-only key scoped to a single dataset.
Step 2 - Integrate with React
2.1 The error boundary's job
An error boundary is a React component that catches rendering errors in the tree beneath it, so a single broken component does not blank the entire application. It is also the natural place to report those errors somewhere useful.
// App.jsx - wrap the tree once, at the top
import ErrorBoundary from './ErrorBoundary';

const App = ({ children }) => {
  return <ErrorBoundary>{children}</ErrorBoundary>;
};

export default App;
2.2 Install the libraries
- libhoney - sends structured events to Honeycomb
- detect.js - parses browser, OS and device details from the user agent
- uuid - generates a unique trace ID per event
npm install libhoney detect.js uuid2.3 Collect browser context
// get-browser-data.js
import detect from 'detect.js';

export const getBrowserData = () => {
  const data = detect.parse(navigator.userAgent);
  return { ...data };
};
2.4 Create a single Honeycomb client
Create the client once, at module level. This is the most common mistake in the setups I have reviewed - instantiating it inside a component means a new client on every render.
// honeycomb.js
import Libhoney from 'libhoney';
import { v4 as uuidv4 } from 'uuid';
import { getBrowserData } from './get-browser-data';

const honeycomb = new Libhoney({
  dataset: import.meta.env.VITE_HONEYCOMB_DATASET,
  writeKey: import.meta.env.VITE_HONEYCOMB_KEY,
  disabled: import.meta.env.DEV,   // do not ship local noise to production data
});

export function logError(error, extra = {}) {
  const browser = getBrowserData();

  honeycomb.sendNow({
    Error: error?.message ?? String(error),
    'Error Stack': error?.stack ?? '',
    Browser: browser?.browser?.name,
    'Browser Version': browser?.browser?.version,
    Device: browser?.device?.type,
    OS: browser?.os?.family,
    URL: typeof window !== 'undefined' ? window.location.href : '',
    TraceId: uuidv4(),
    Release: import.meta.env.VITE_APP_VERSION,
    ...extra,
  });
}
2.5 The error boundary itself
// ErrorBoundary.jsx
import PropTypes from 'prop-types';
import React from 'react';
import { logError } from './honeycomb';

class ErrorBoundary extends React.Component {
  state = { hasError: false, error: null };

  static getDerivedStateFromError(error) {
    return { hasError: true, error };
  }

  componentDidCatch(error, errorInfo) {
    // React rendering errors land here - report them with the component stack.
    logError(error, { Source: 'react', 'Component Stack': errorInfo.componentStack });
  }

  componentDidMount() {
    // Errors outside the React tree (event handlers, async code) never reach
    // componentDidCatch, so register global handlers too.
    window.addEventListener('error', this.handleWindowError);
    window.addEventListener('unhandledrejection', this.handleRejection);
  }

  componentWillUnmount() {
    window.removeEventListener('error', this.handleWindowError);
    window.removeEventListener('unhandledrejection', this.handleRejection);
  }

  handleWindowError = (event) => {
    logError(event.error ?? event.message, {
      Source: 'window',
      'Error File URL': event.filename,
      'Error Line': event.lineno,
      'Error Column': event.colno,
    });
  };

  handleRejection = (event) => {
    logError(event.reason, { Source: 'unhandled-promise' });
  };

  render() {
    if (this.state.hasError) {
      return (
        <div role="alert">
          <h1>Something went wrong.</h1>
          <p>We have been notified and are looking into it.</p>
          <button type="button" onClick={() => window.location.reload()}>
            Reload the page
          </button>
        </div>
      );
    }
    return this.props.children;
  }
}

ErrorBoundary.propTypes = { children: PropTypes.node.isRequired };

export default ErrorBoundary;Error boundaries catch errors during rendering only. They do not catch errors in event handlers, in setTimeout callbacks, in async code, or during server-side rendering. That is exactly why the global error and unhandledrejection listeners above exist - together they close the gap. Also note that side effects belong in lifecycle methods, never in render.
2.6 What each event carries
Every event sent above includes the message and stack trace, the browser name and version, the device type and OS family, the URL where it happened, the release version, and a unique TraceId.
That trace ID is the single most useful field on the list. Surface it in your error UI ("reference: a3f2-…") and a support conversation goes from "it broke somewhere" to one query returning the exact event.
A note on datasets
Honeycomb organises events into datasets - logical groupings of related events. You might use one for your frontend, another for a backend service. The dataset is set when you initialise the libhoney client, and it is what you query against. Keeping frontend and backend separate makes it much easier to filter, compare and build focused dashboards.
2.7 Log more than errors
The same logError pattern generalises. Anywhere you have context worth keeping, send an event:
try {
  await submitEnrolment(values);
} catch (error) {
  logError(error, {
    Source: 'enrolment-form',
    'Form Step': currentStep,
    'Field Count': Object.keys(values).length,
  });
  setSubmitError('We could not submit that. Please try again.');
}
Structured fields like Form Step are what turn a pile of errors into an answer - "94% of these failures happen on step three" is a finding you can act on.
2.8 Test the setup
Rather than waiting for a real failure, trigger one deliberately. Add a temporary button:
<button
  type="button"
  onClick={() => {
    const sampleData = { name: 'Abhay' };
    sampleData.map((item) => item?.name);  // objects have no .map
  }}
>
  Trigger a test error
</button>This error is thrown inside an event handler, which means the error boundary will not catch it - the global error listener will. Running it proves both halves of your setup, not just the React half.
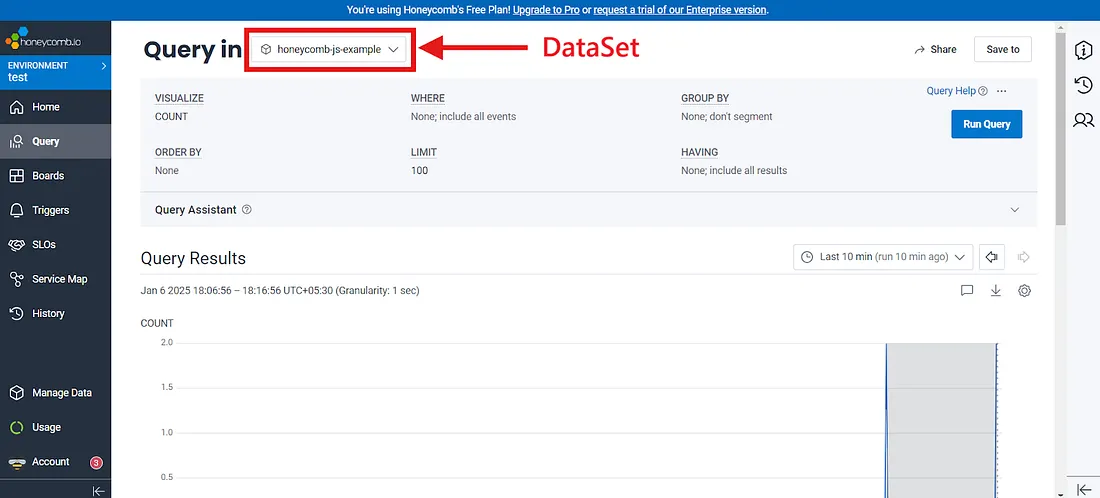
Then check the dashboard:
- Log in to Honeycomb and open the dataset you configured
- Click Run Query to fetch recent events
- Scroll down to see the event with its message, stack, browser data and
TraceId
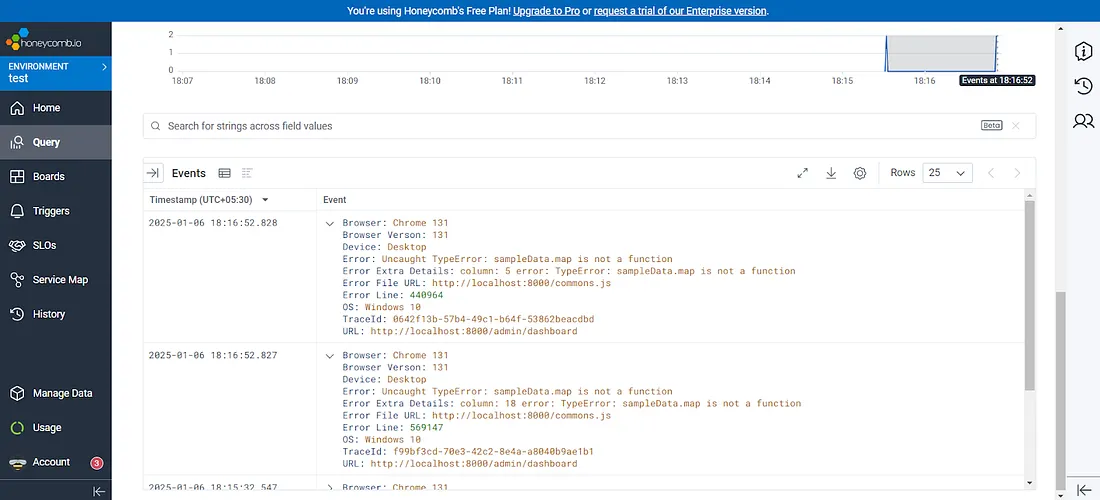
2.9 Filtering and analysis
Once events are flowing, Honeycomb's filters are where the value is:
- TraceId - isolate one specific incident instantly
- Error message - group every occurrence of the same failure
- Browser or device - spot problems that only affect one environment
- Release - confirm whether a deploy introduced or fixed something
Step 3 - Set up alerts
Errors do not announce themselves, and nobody watches a dashboard all day. Honeycomb Triggers close that loop.
What triggers are
A trigger is a saved query that Honeycomb runs on a schedule. If the result crosses a threshold you defined, it notifies you. When the condition clears, you get a resolution notice.
Creating one
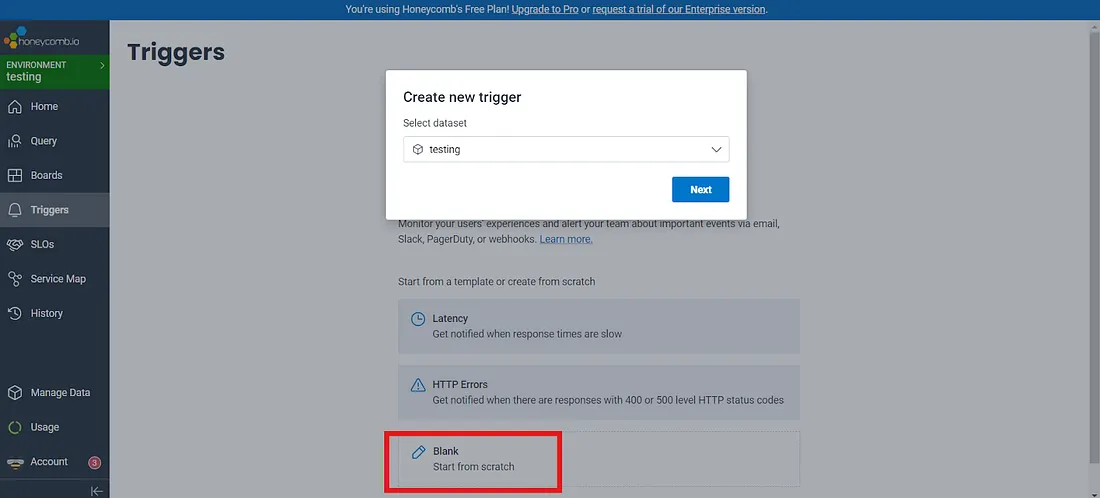
1. Open the Triggers page from the dashboard menu.
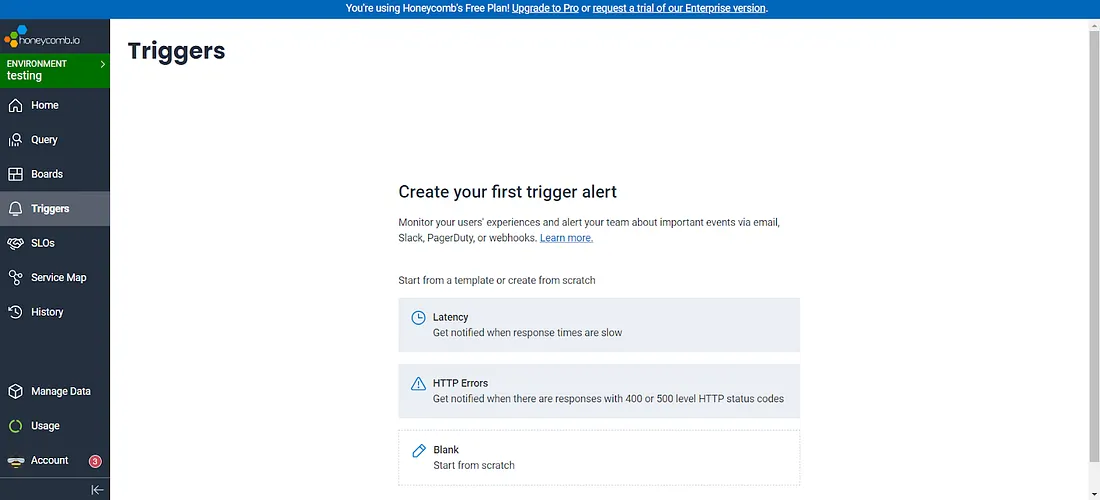
2. Create a new trigger - choose Blank — Start from Scratch and select the dataset holding your error events.
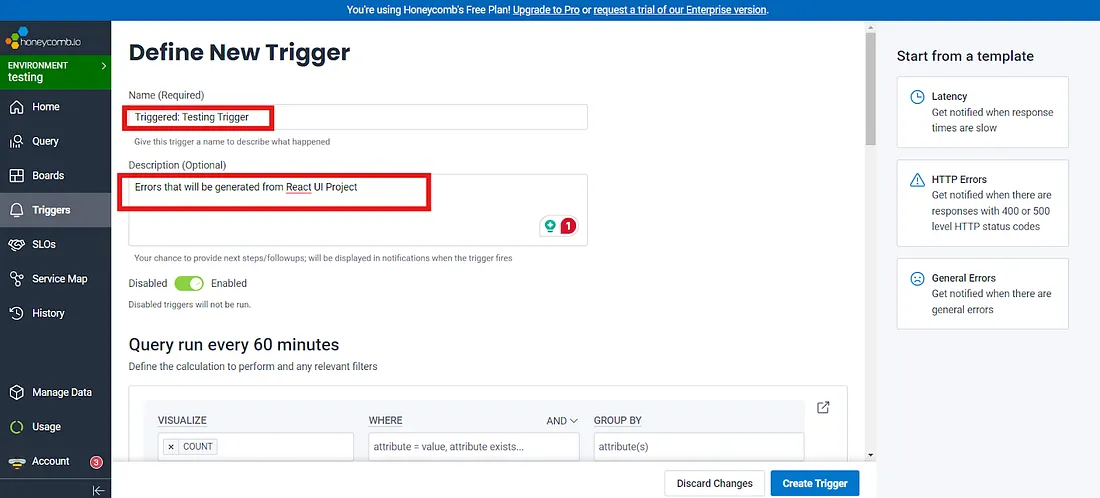
3. Name and describe it. The description appears in the alert email, so write it for the person reading at 7am - "Frontend errors detected in production" beats "trigger 1".
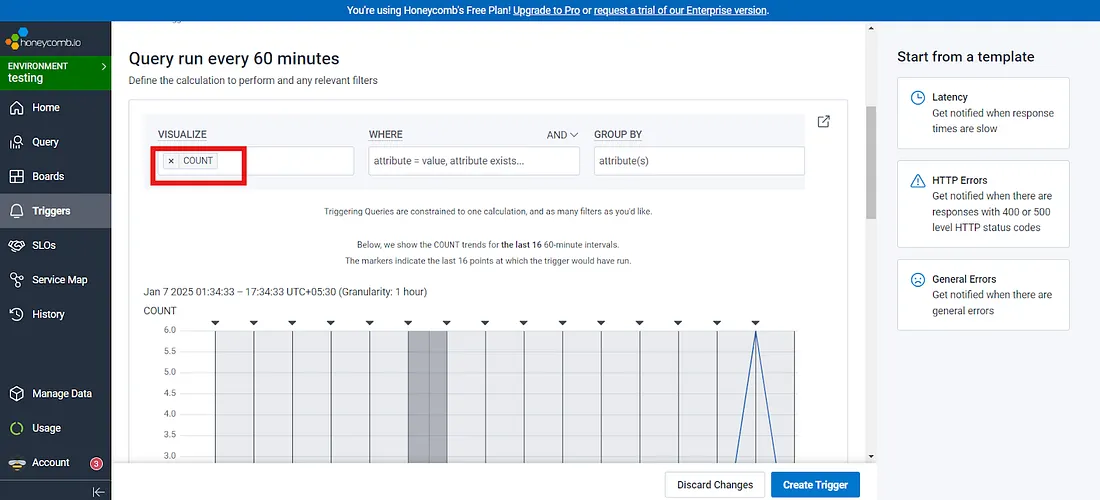
4. Define the query. For a simple error alert, COUNT over the dataset is enough.
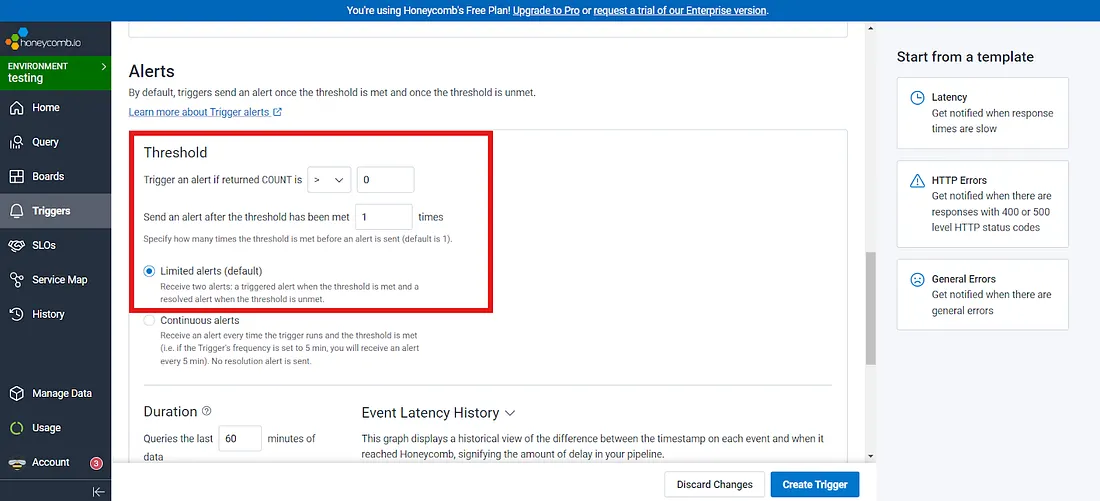
5. Set the alert condition - for example COUNT > 0. Choose Limited Alerts so you get one notification when the condition is met and one when it clears, rather than a message every evaluation.
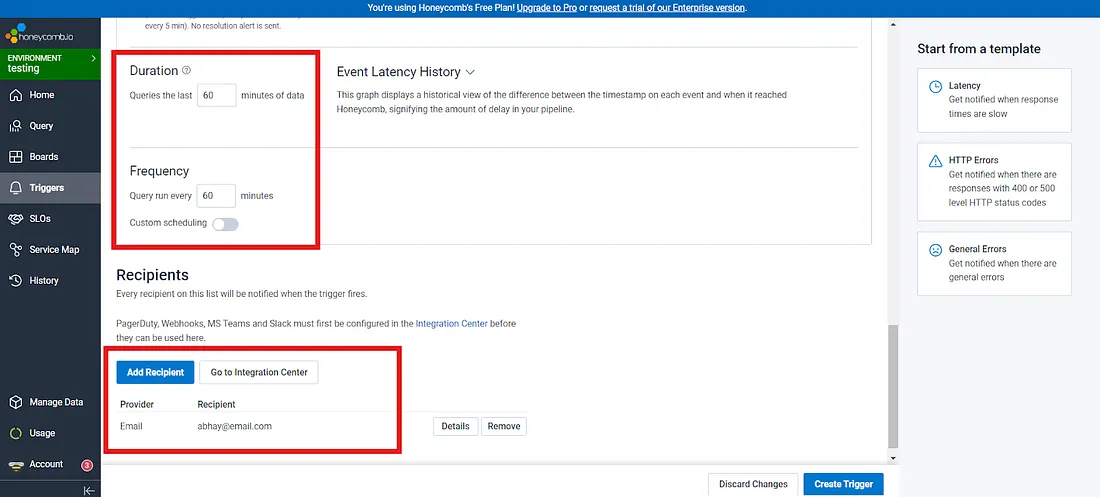
6. Set frequency and duration. Frequency is how often the query runs; duration is the window it looks back over. Sixty minutes for both is a reasonable starting point.
7. Add recipients. Click Notify by Email and add the addresses that should receive it. Slack and PagerDuty integrations are available too.
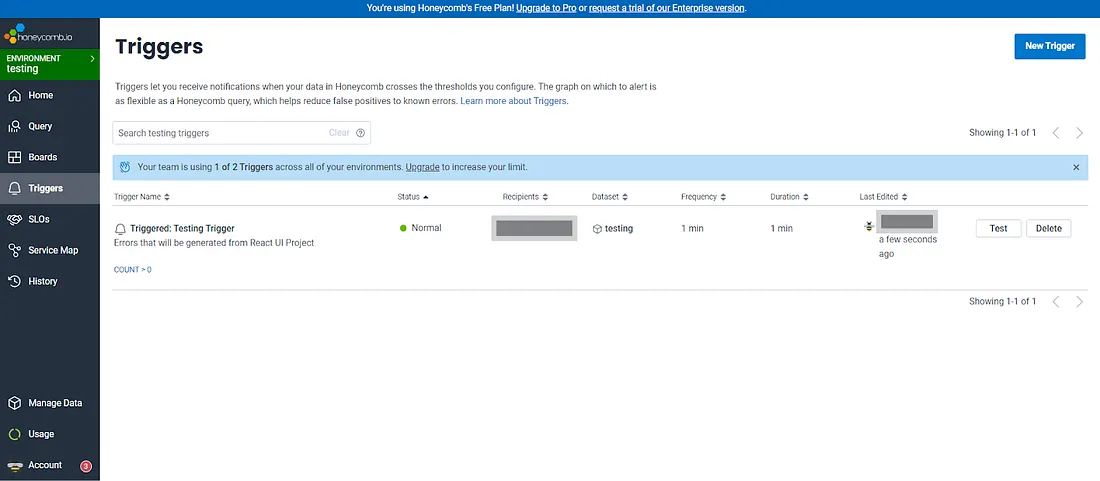
8. Create and test. Save the trigger, fire your deliberate test error, and confirm the email arrives.
What happens when it fires
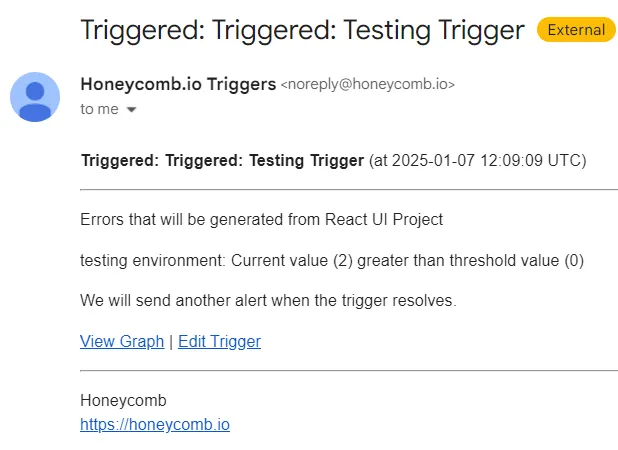
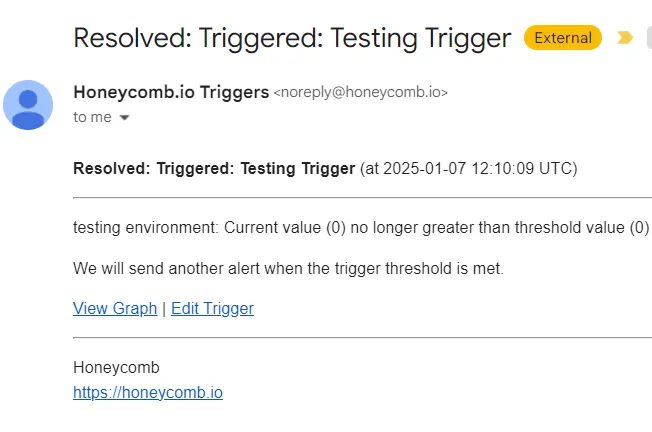
You get a triggered email when the threshold is crossed, and a resolved email when it clears - so you know both that something broke and that it stopped.
COUNT > 0 is perfect on day one and unbearable by week three. Once you know your baseline, raise the threshold to something meaningful, or trigger on a spike relative to normal. An alert that fires constantly is an alert everybody has already muted.
Conclusion
With an error boundary, global handlers, structured events and one well-tuned trigger, you have gone from finding out about failures through support tickets to finding out about them from a system that was watching the whole time.
The setup is an afternoon of work. The payoff is every future incident starting with an answer instead of a question.