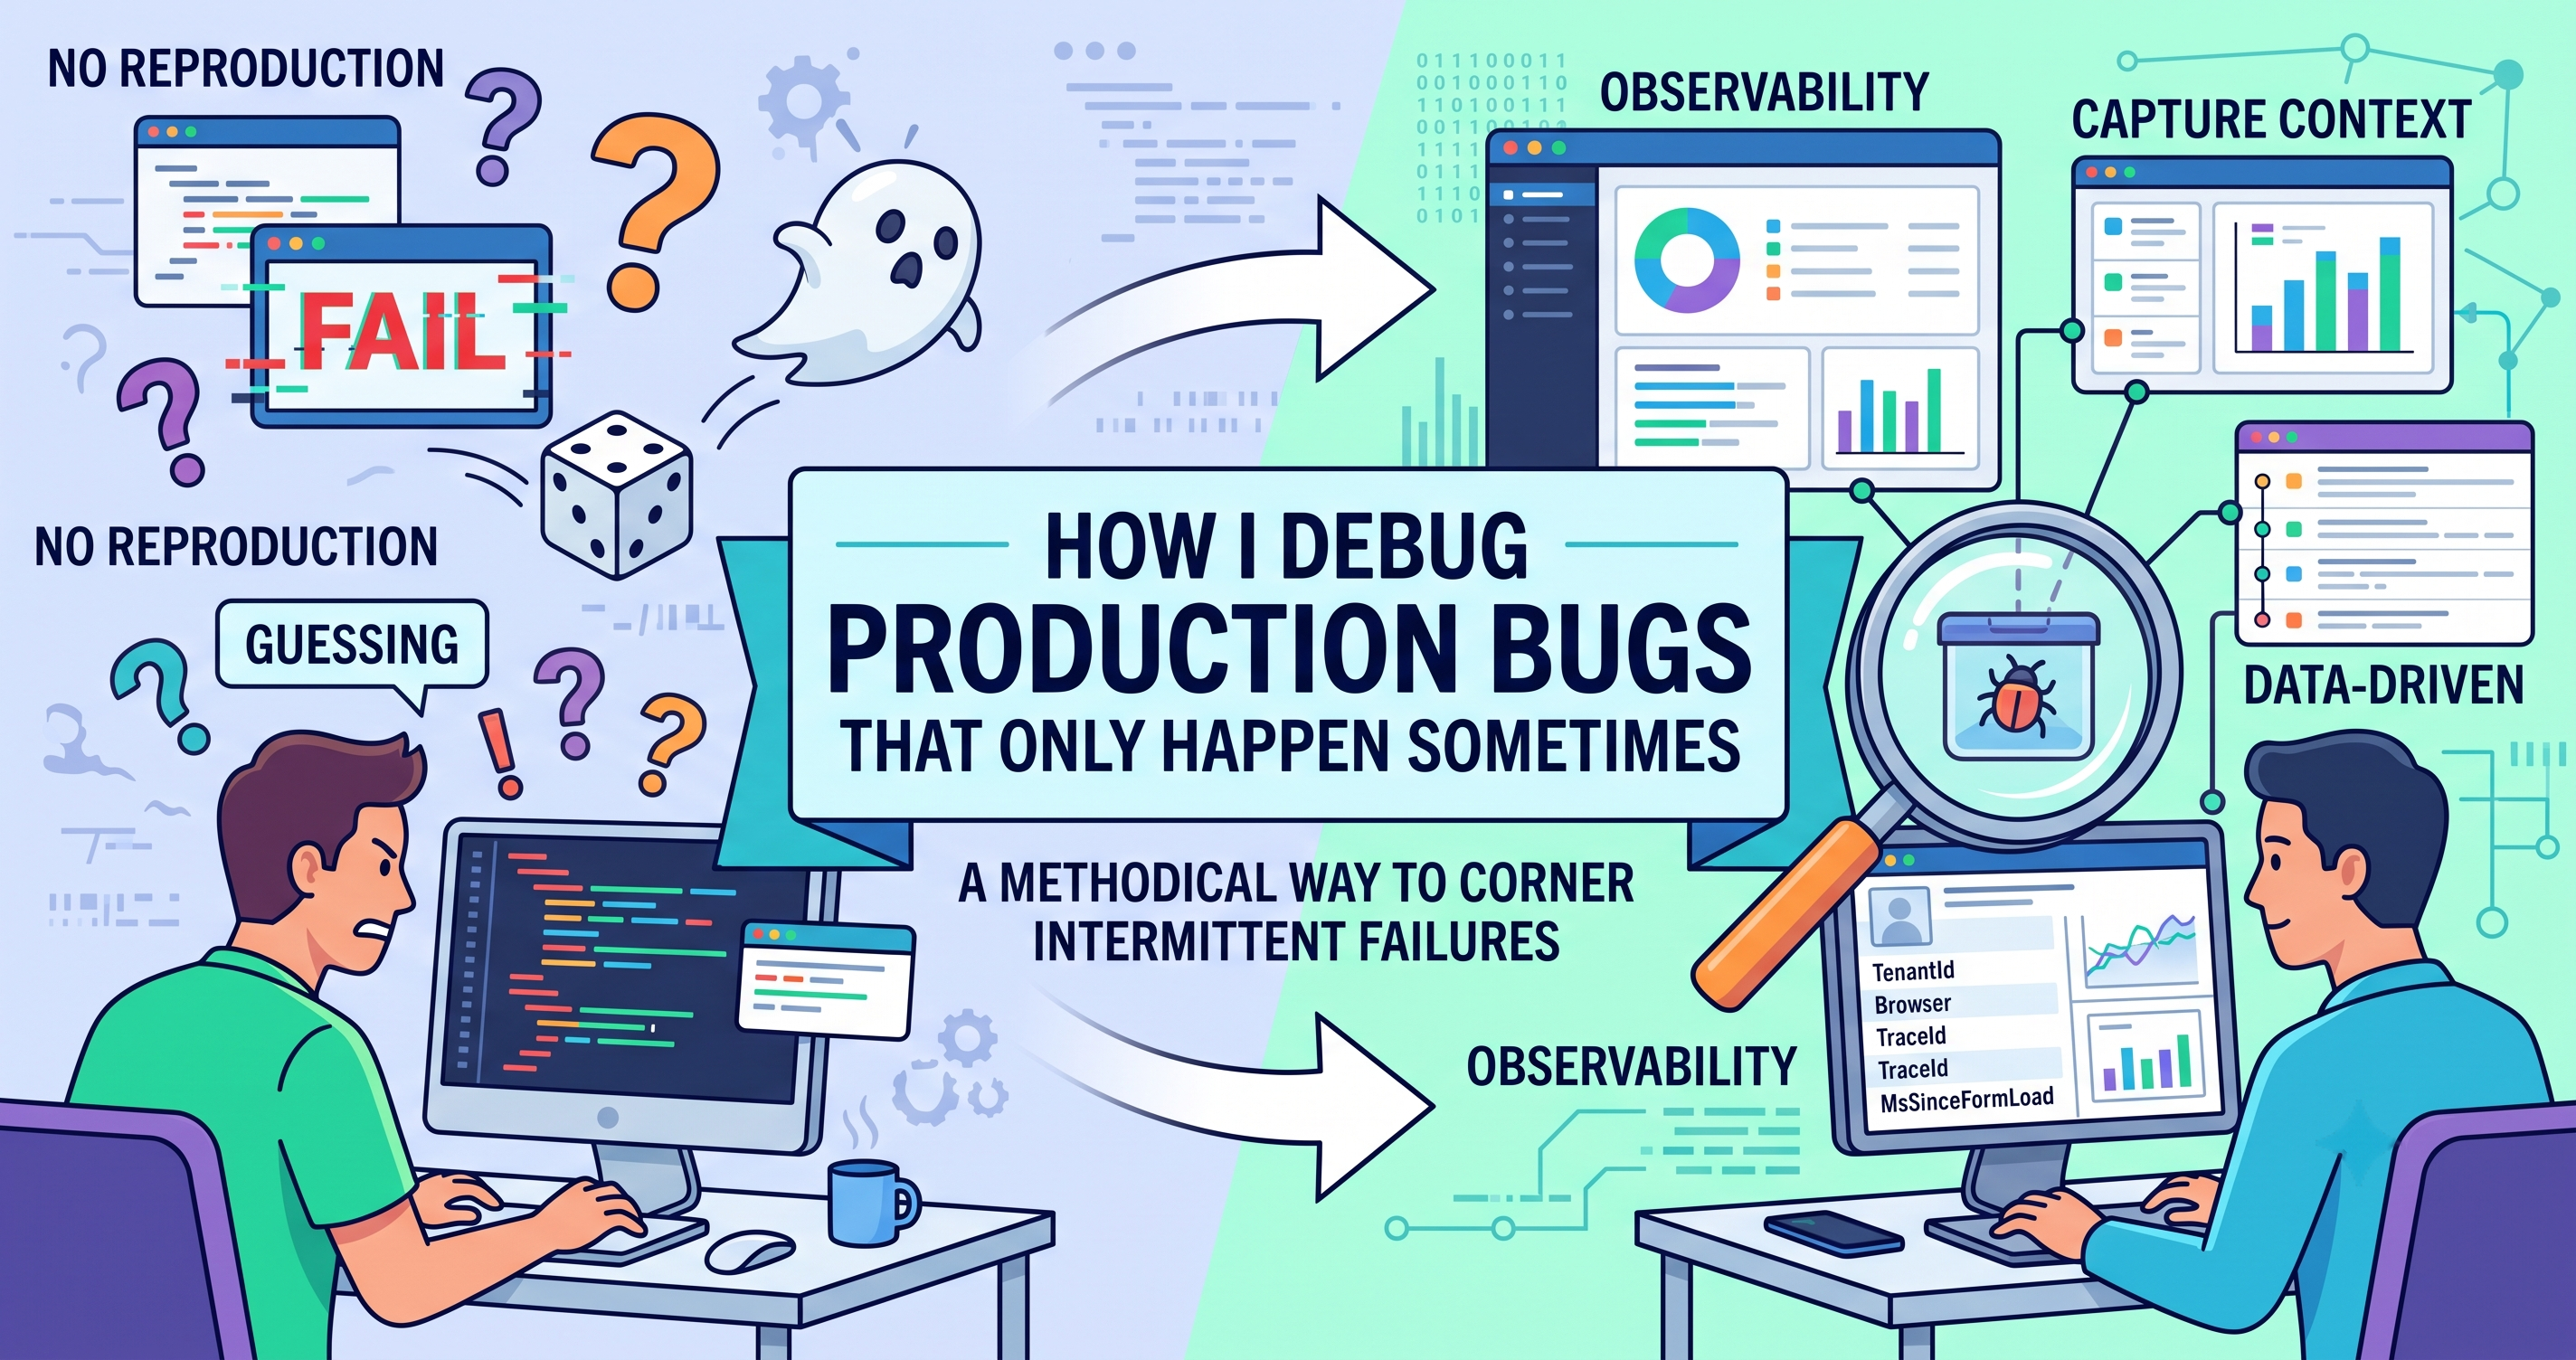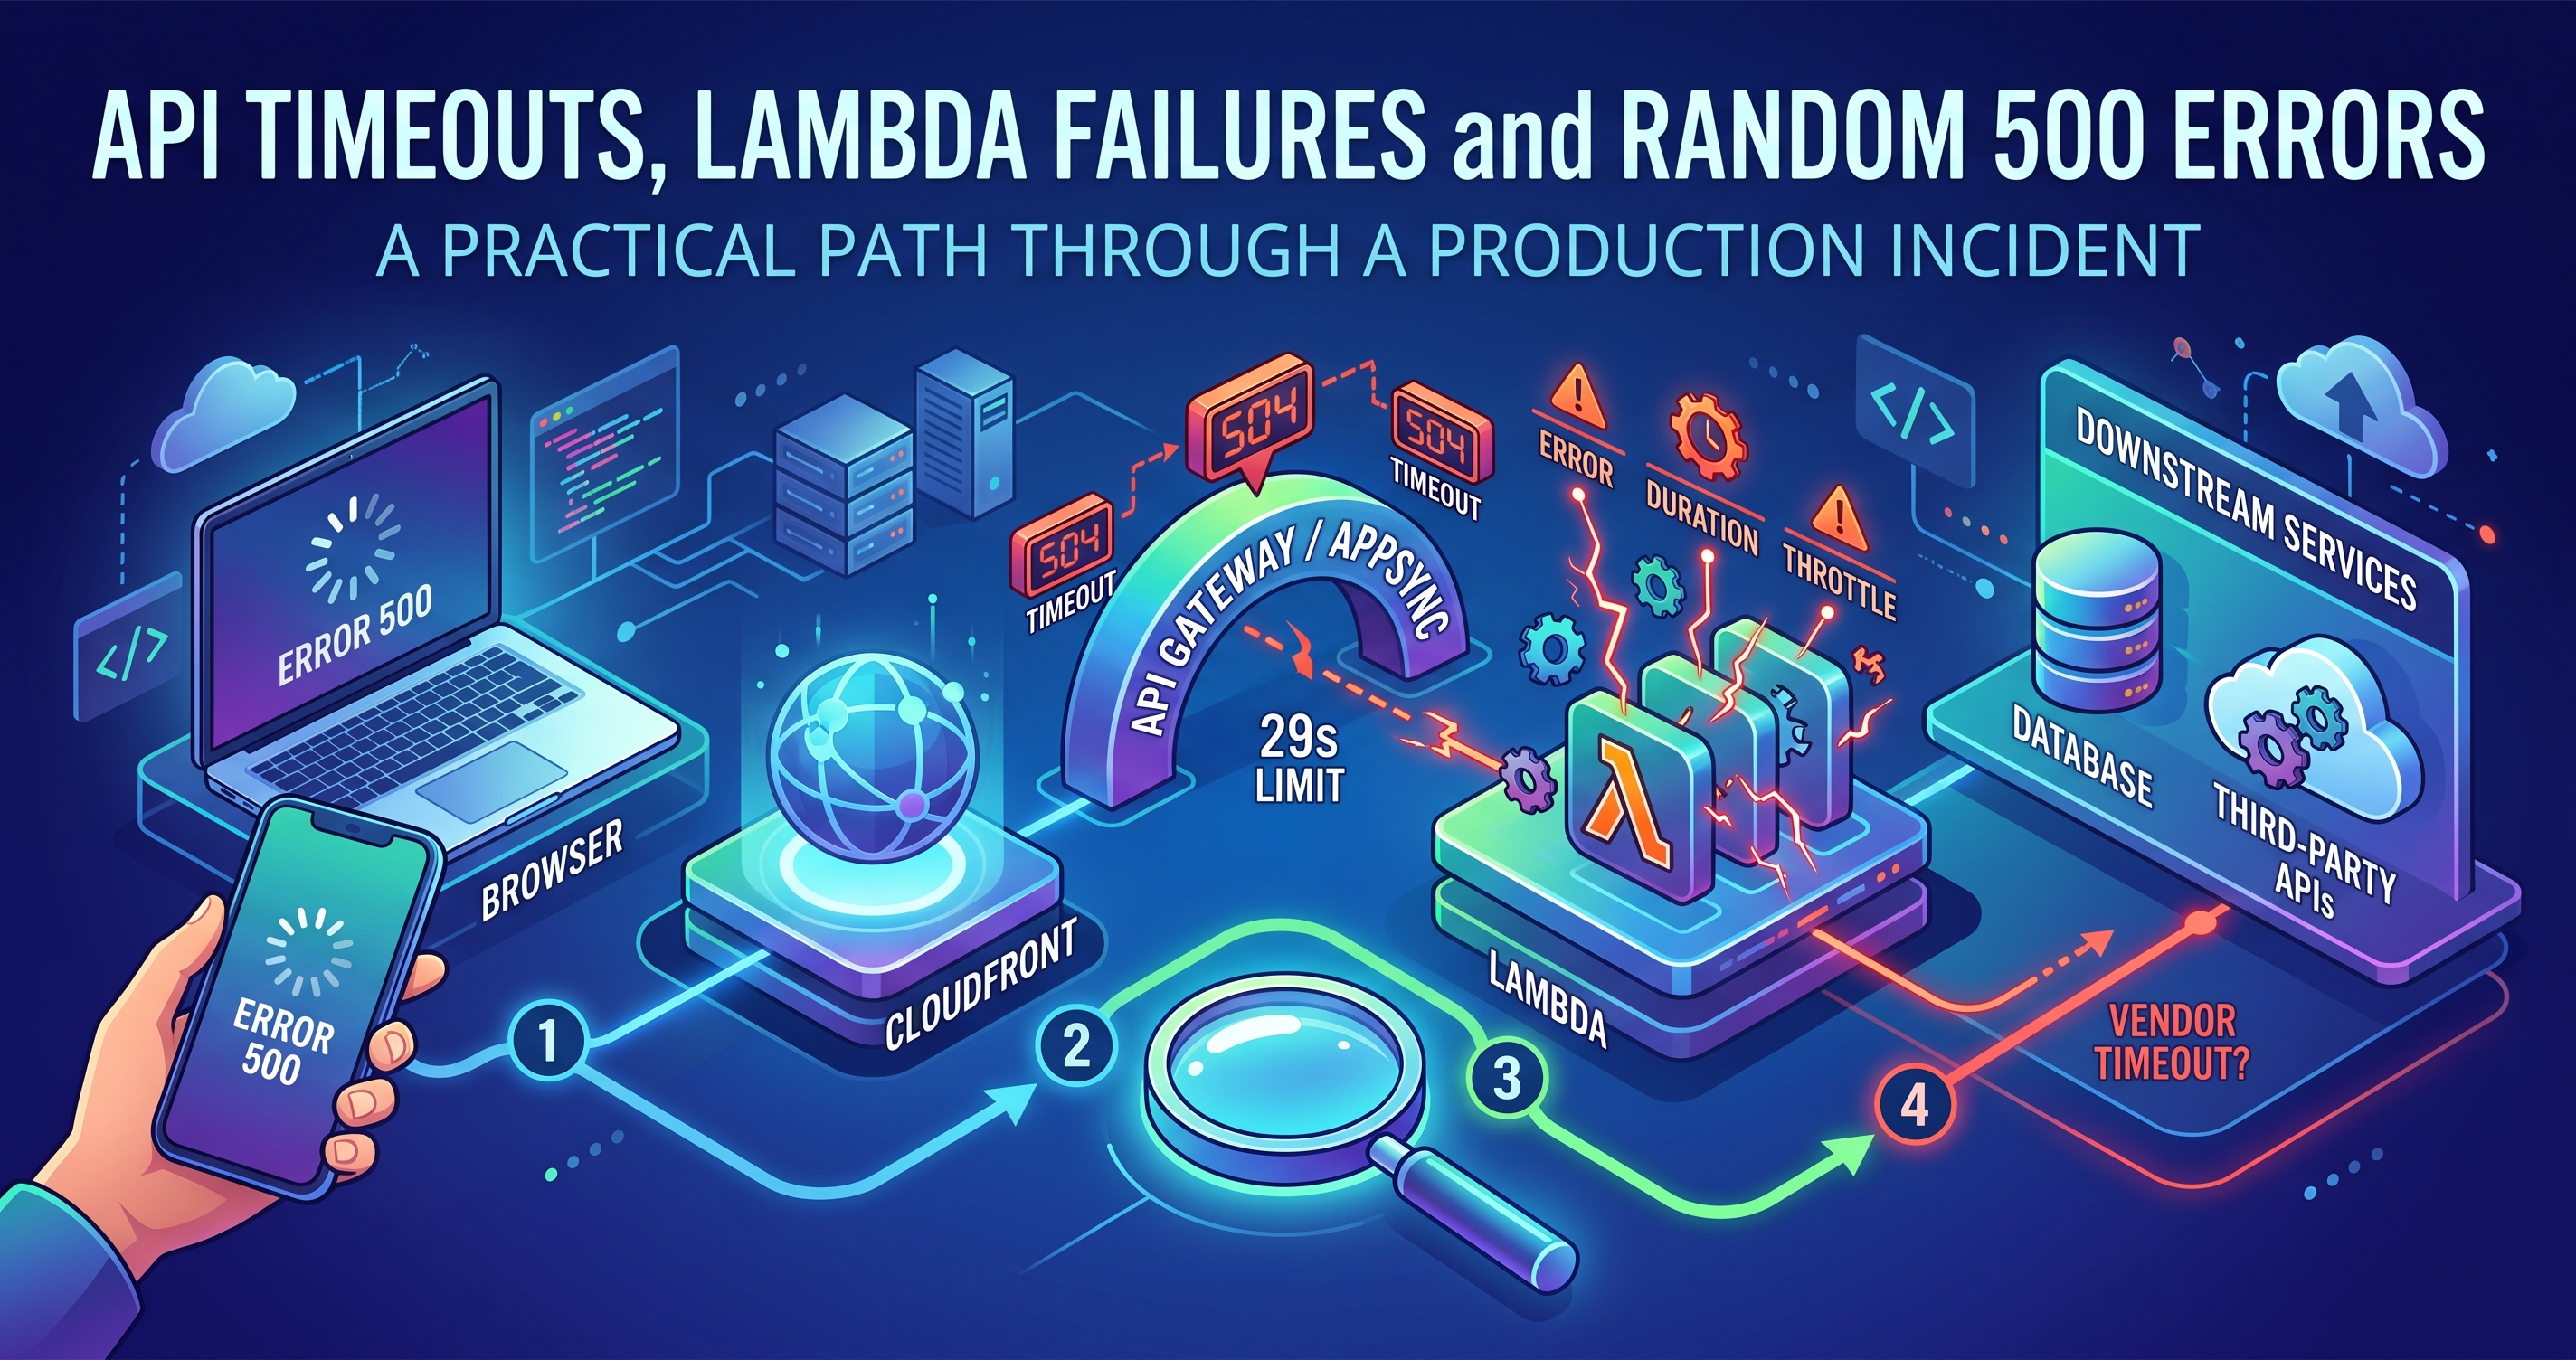
It is 9:40am. Support has three tickets in ten minutes. Members are seeing a spinner and then an error on the enrolment screen. It is not everyone — maybe one in five.
You open the app. It works. You refresh. It works again.
Somewhere between a browser and a database there are six or seven components, any of which could be responsible, and the natural instinct is to start with the one you know best. That is almost always the wrong order, and it is how a twenty-minute incident becomes three hours.
Here is the sequence I follow, and why it is in this order.
Before anything: get the trace ID
If you take one thing from this article, take this. Every request that enters your system should carry an identifier that appears in every log line, every span, and in the error the user sees.
// At the edge — generate once, propagate everywhere
const traceId = request.headers['x-trace-id'] ?? crypto.randomUUID();
Then surface it in the UI when something fails:
<p>Something went wrong. If you contact support, quote <code>{traceId}</code>.</p>That single string turns “a member says enrolment failed this morning” into one query returning the exact request, the exact function invocation, and the exact downstream call that failed. Without it you are searching by timestamp and hoping.
Narrow the blast radius first, not the cause
Resist opening code. Spend the first five minutes answering four questions, because the answers eliminate most of the search space.
| Question | If yes |
|---|---|
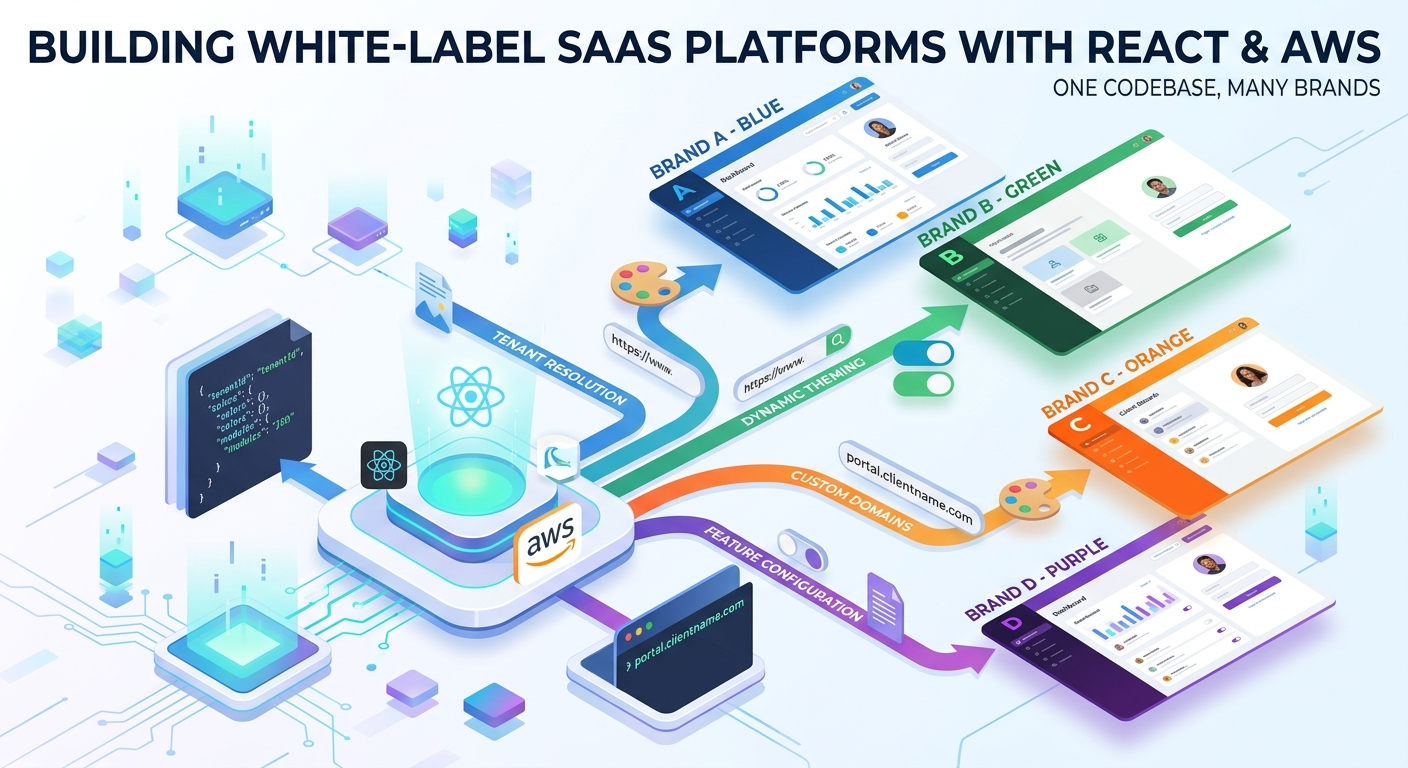
| Is it one tenant or all of them? | One tenant points at configuration or that client's data, not your code |
| Is it one endpoint or everything? | One endpoint means one function; everything means auth, network or the edge |
| Did it start at a specific time? | Line it up against deploys, config changes and scheduled jobs |
| Is it a clean error or a timeout? | A fast 500 is logic. A slow failure is capacity, a downstream, or a limit. |
That last distinction matters more than people expect. Fast failures and slow failures have almost entirely different causes. Knowing which you have halves the problem immediately.
Then walk the path in order
Follow the request. Do not skip ahead to the component you suspect.
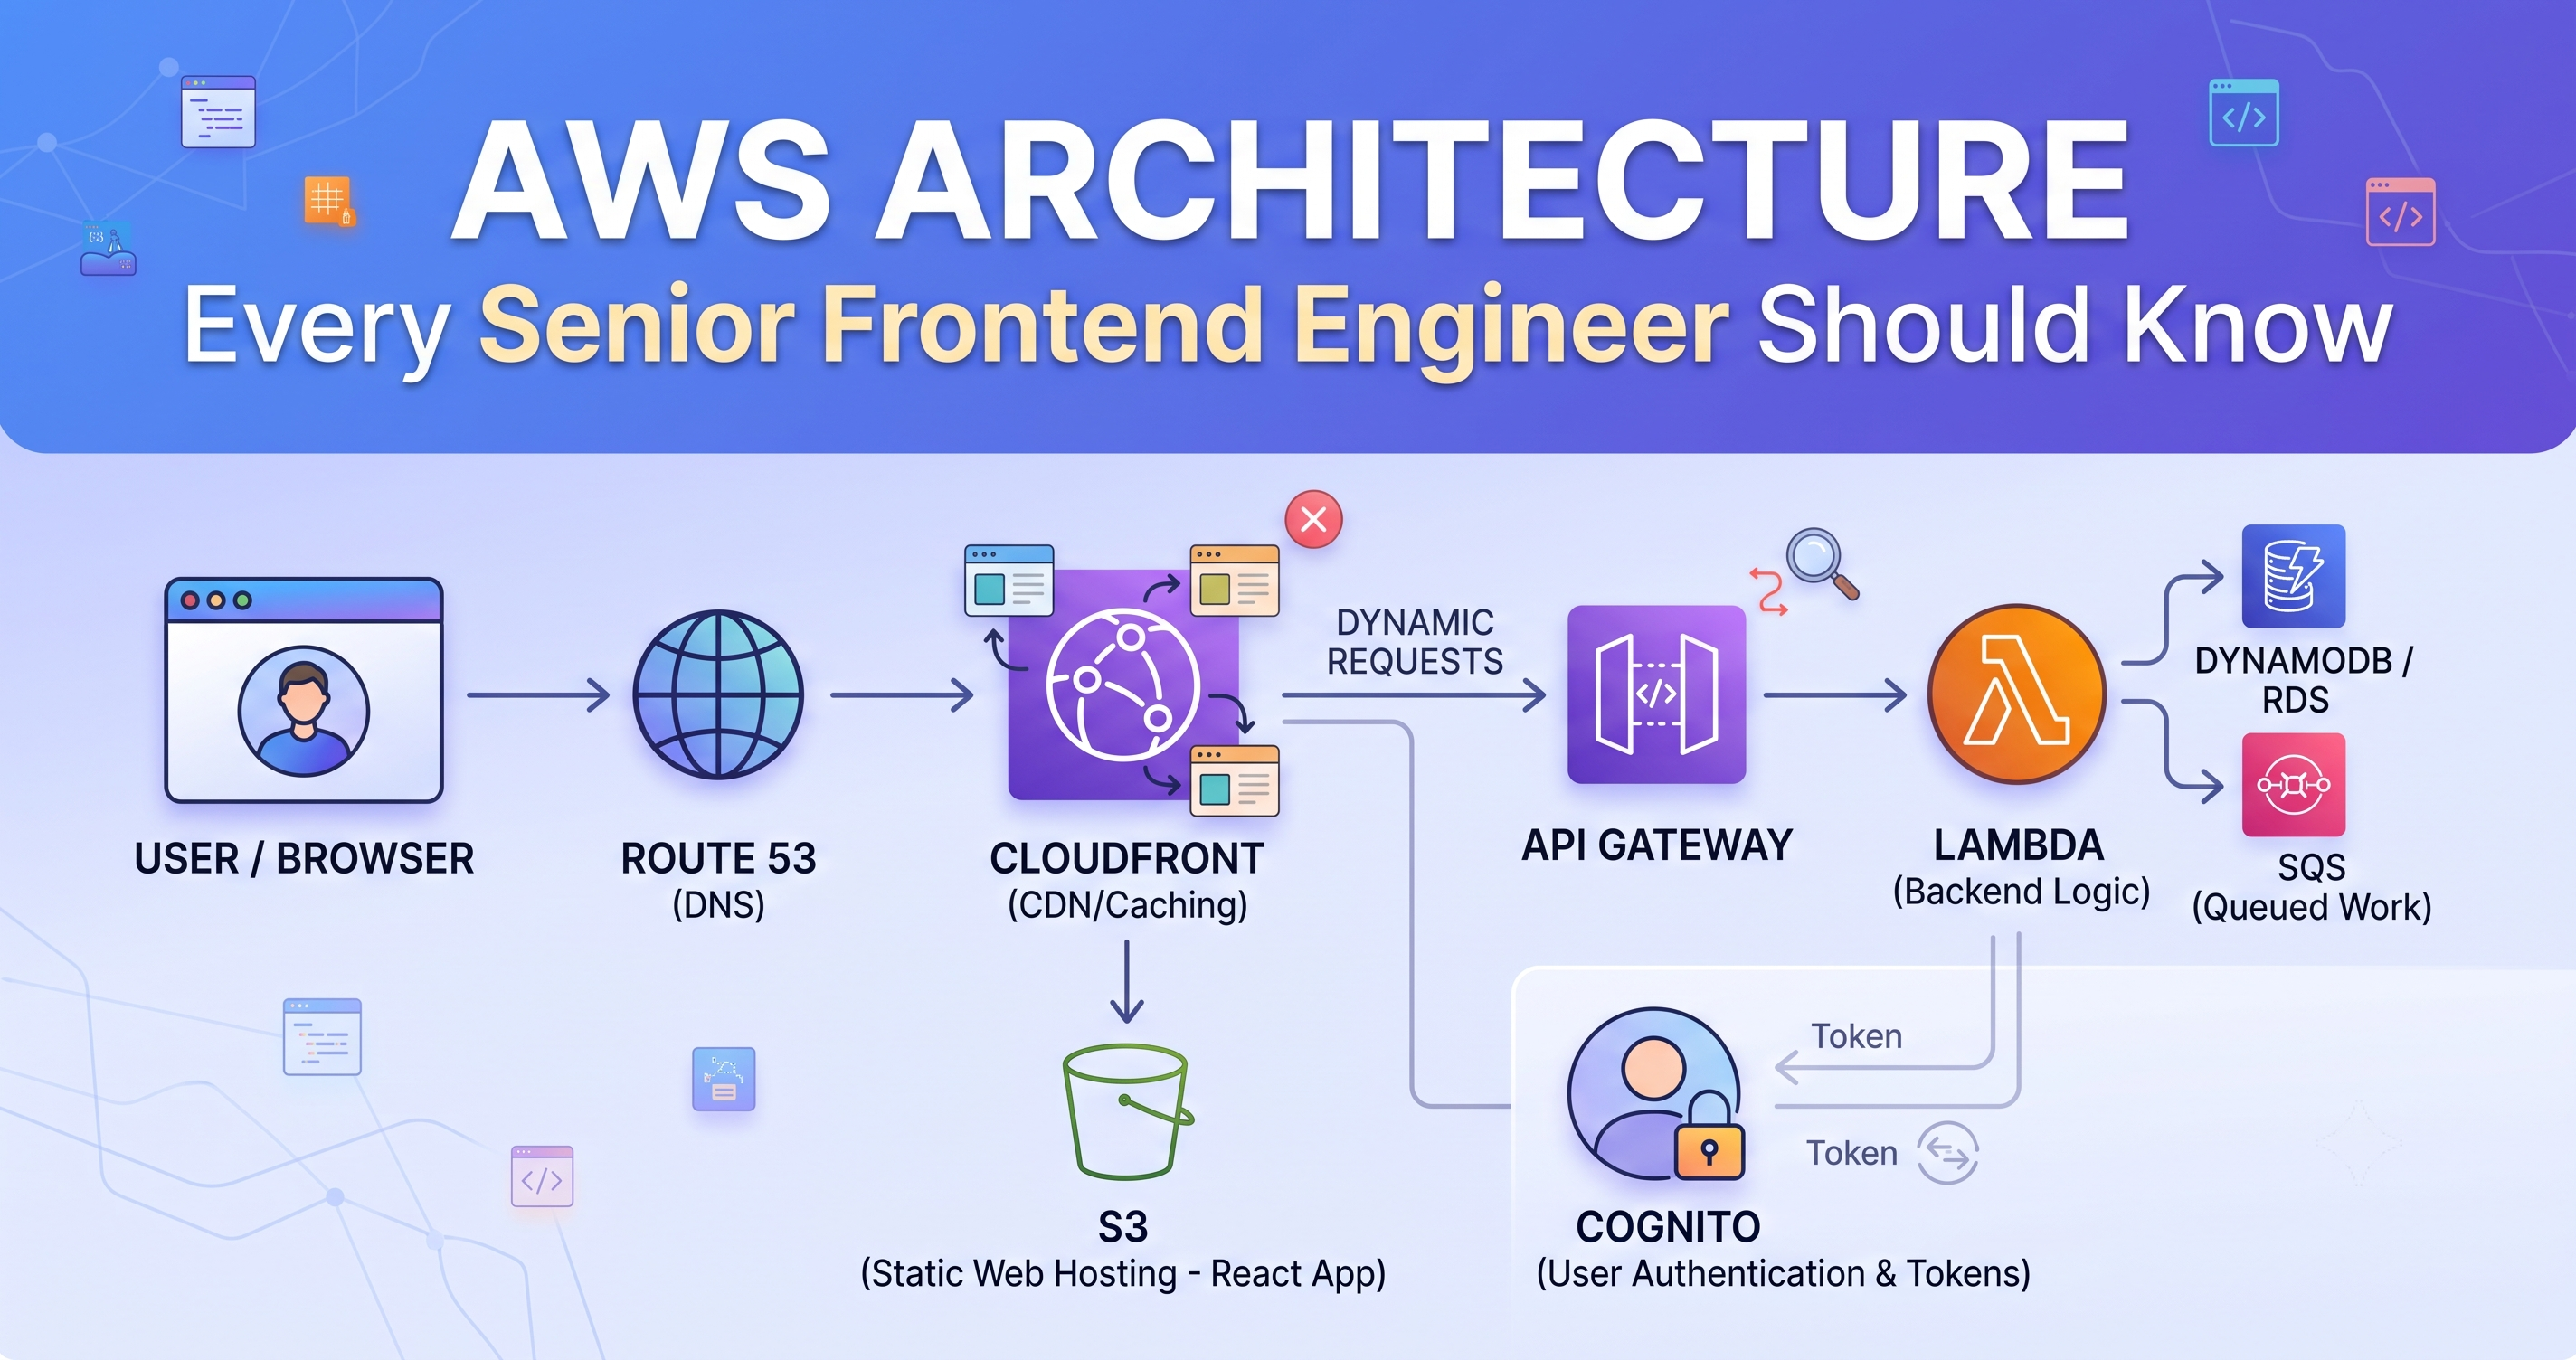
Browser → CloudFront → API Gateway / AppSync → Lambda → downstream
                                                          (DB, vendor, queue)
Layer 1 — the browser
Open the network tab on a failing request and read three things.
- Status code. A
504is a timeout upstream. A502means your function returned something malformed or crashed. A403from CloudFront with no CORS headers is usually the edge rejecting the request before your code ever ran. - Duration. If it failed at 29 seconds, you have found an API Gateway timeout, not a bug.
- Whether the request was sent at all. A CORS failure or an aborted request never reached your backend, and no amount of reading Lambda logs will help.
When a Lambda errors without returning proper headers, the browser reports it as a CORS failure. Teams then spend hours on CORS configuration when the actual problem is an unhandled exception. If CORS worked yesterday and broke today without a config change, it is not CORS — it is your function failing before it can respond.
Layer 2 — the edge and the gateway
Two things to check here, and both are limits rather than bugs.
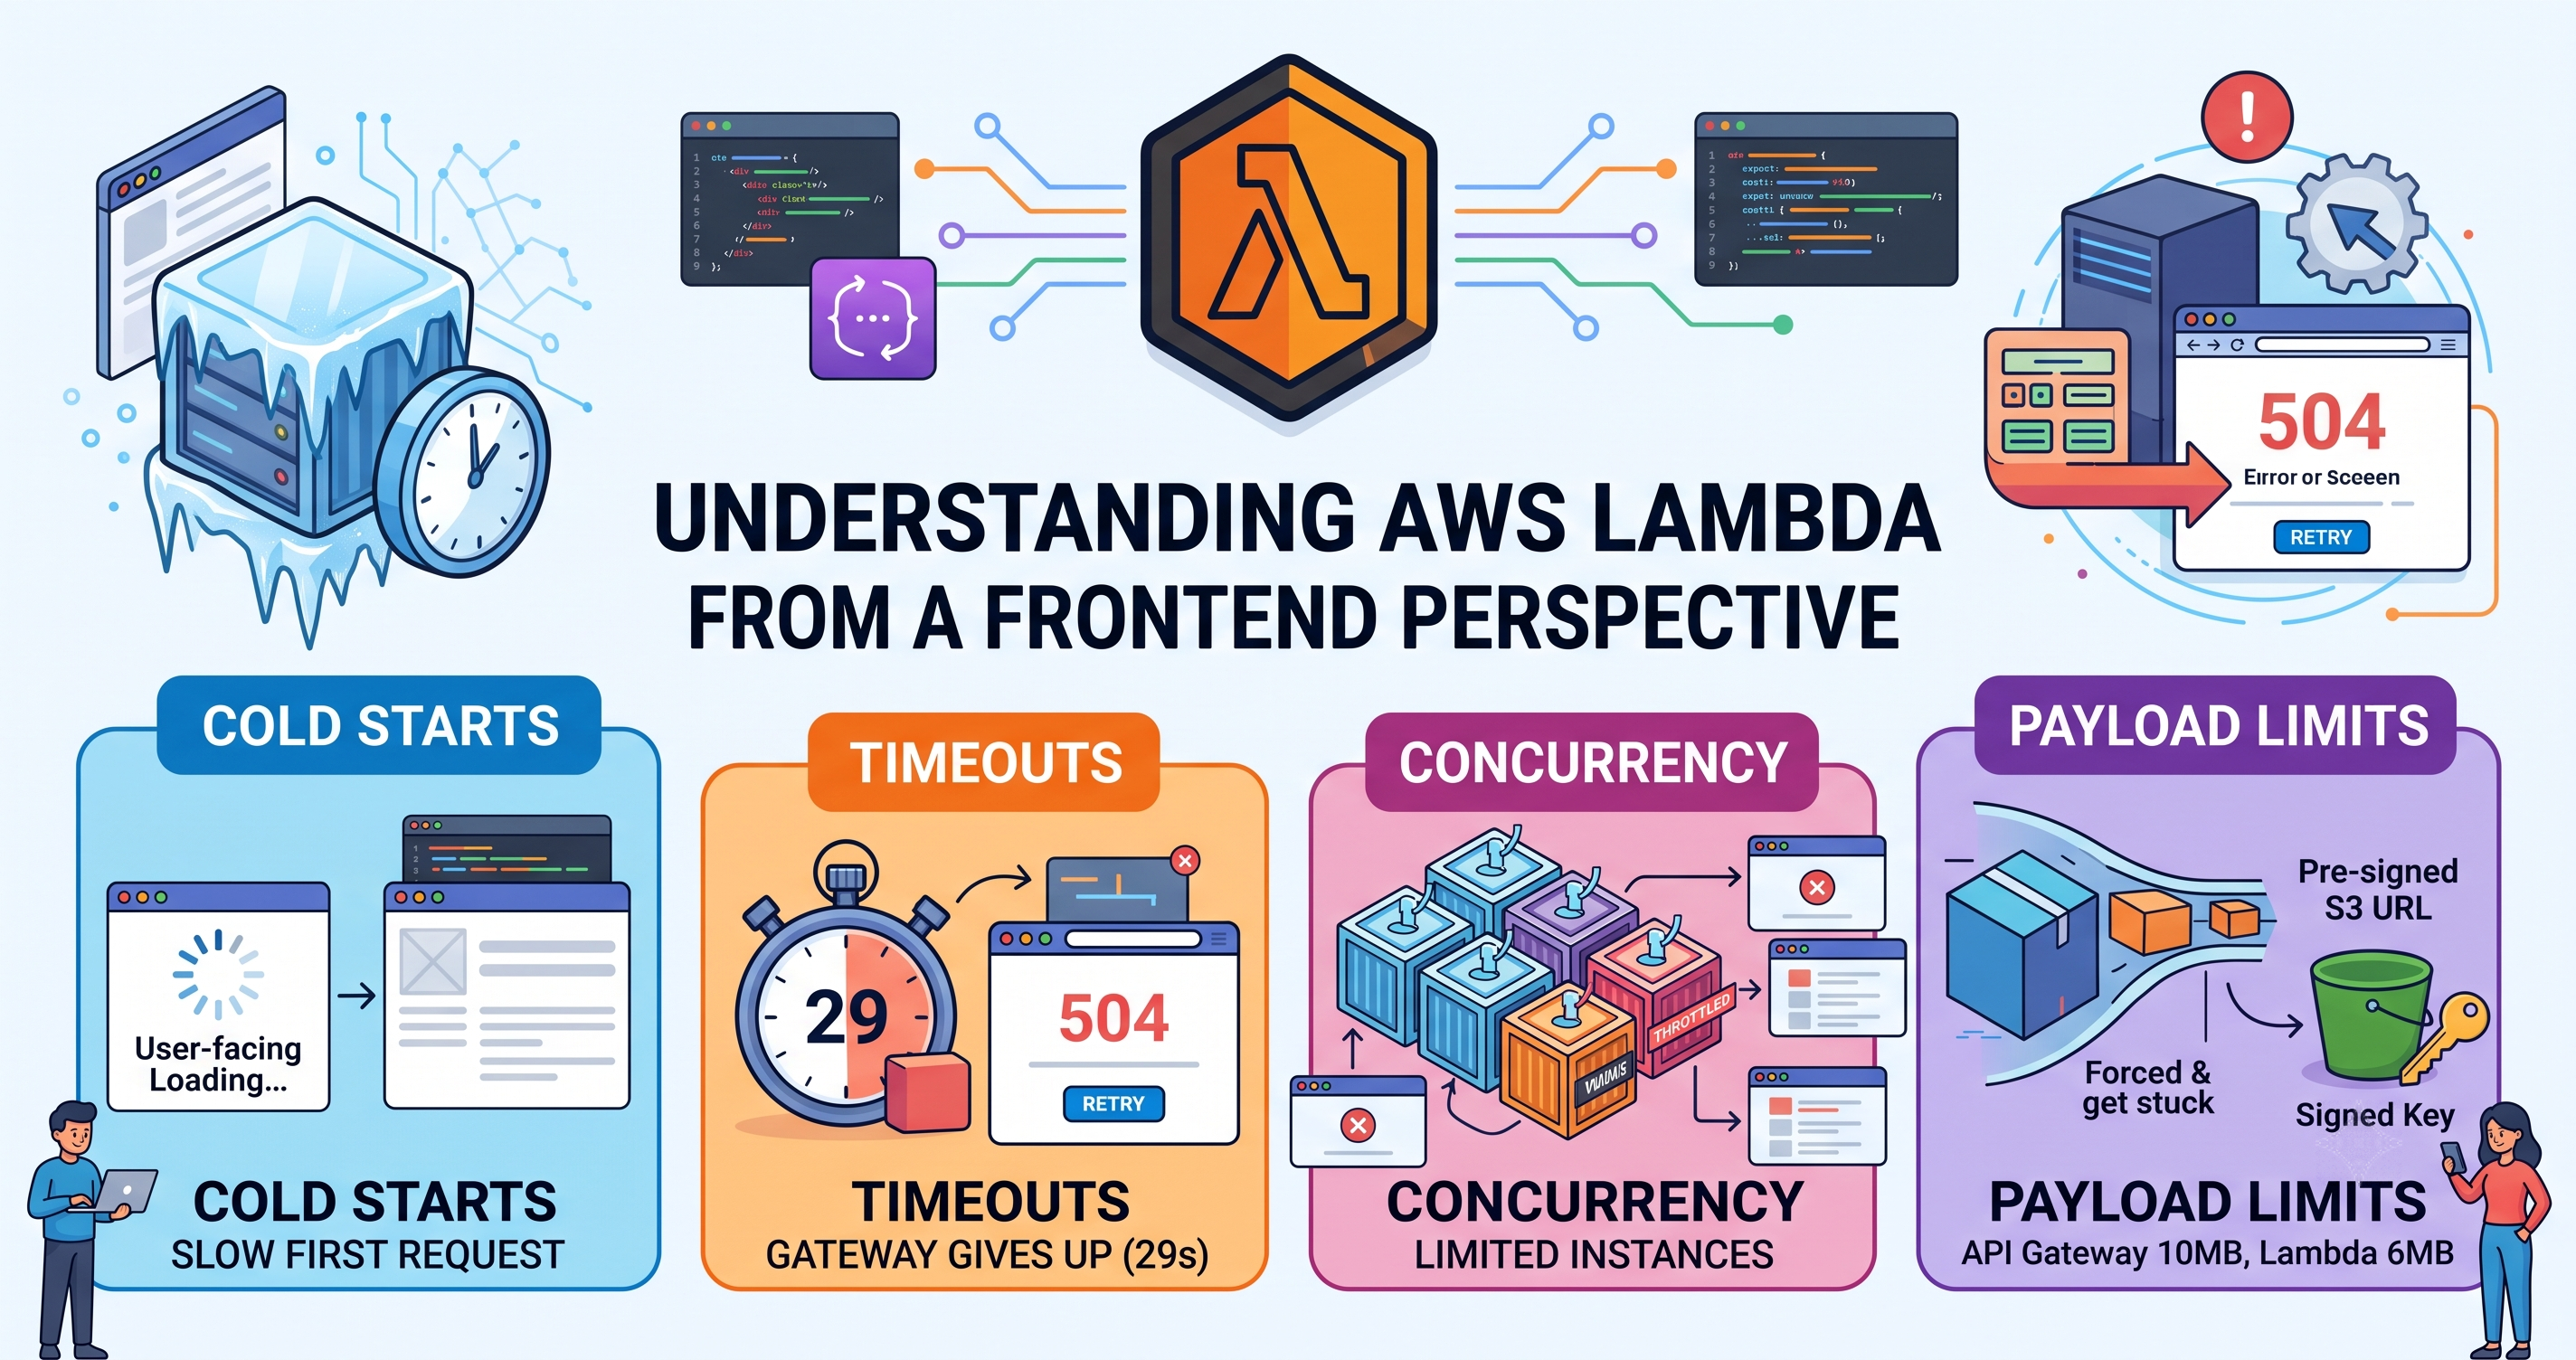
The 29-second ceiling. API Gateway will not wait longer than that, whatever your Lambda timeout says. If your function is configured for 60 seconds, the gateway gives up first and the user gets a 504 while your function keeps running — and keeps billing. Any operation that can legitimately take longer needs to be asynchronous: accept the request, return a job ID, and let the client poll or subscribe.
Payload limits. Roughly 10MB through API Gateway, 6MB for a synchronous Lambda response. Document generation and bulk exports hit this, and the failure is confusing because it works for every small case in testing. Return a pre-signed S3 URL rather than the file itself.
Layer 3 — Lambda
Now open the function metrics, and look at four numbers before you look at any logs.
Errors vs Invocations. Gives you the actual failure rate, which is usually different from what support is reporting.
Duration, p99 not average. The average hides the problem entirely. If p99 is near your timeout, you have found it.
Throttles. Anything above zero means you hit a concurrency limit. The user sees a 500 and your code is blameless.
Init duration. The gap between billed and executed duration is cold start. If failures cluster after idle periods or immediately after a deploy, this is your answer.
Only then read the logs, filtered by trace ID.
Layer 4 — downstream
If the function is timing out and the code looks fine, the function is usually waiting on something else.
// The bug: no timeout, so a slow vendor becomes YOUR timeout
const eligibility = await vendor.getEligibility(memberId);// Bound it, and decide explicitly what happens when it is exceeded
const eligibility = await withTimeout(
vendor.getEligibility(memberId),
3000,
() => ({ status: 'unknown', source: 'timeout' })
);A downstream call without a timeout is not a call, it is a promise to wait forever. In a system that integrates with vendors — eligibility feeds, payment providers, verification services — this is the most common cause of intermittent 504s I encounter.
The four causes that account for most of it
1. Cold start plus a slow dependency
Each is fine alone. Together they exceed the timeout. The signature is failures after quiet periods, and a large gap between init duration and execution duration.
Fixes, in order of cost: trim the deployment package and move initialisation outside the handler; reuse connections across invocations; and only then consider provisioned concurrency, which costs money and is often unnecessary once the first two are done.
// Outside the handler — runs once per container, not once per request
const db = createClient({ keepAlive: true });

export async function handler(event) {
  return db.query(/* ... */);   // reuses the warm connection
}
2. Concurrency throttling
A batch job, a scheduled import, or one large client's traffic consumes the account concurrency pool, and unrelated user-facing functions start returning 500s. The tell is Throttles > 0 on functions that look otherwise healthy.
The fix is reserved concurrency on the user-facing functions so background work cannot starve them, and moving batch work onto a queue with controlled parallelism.
3. One record that breaks the parser
Ninety-nine percent of requests succeed because ninety-nine percent of records are well-formed. Then one has a null where a string is expected, and the function throws before it reaches your error handling.
The tell is a fast failure — no timeout, a clean 500 — affecting a small, stable set of users. Fix the parse, then run a query to find how many other records look like that one, because there will be others.
4. A retry storm
Something fails. The client retries. The queue retries. A step function retries. Suddenly one failing dependency is receiving four times the traffic it was already struggling with, and a small problem becomes an outage.
Check how many layers of your stack are retrying the same operation. The answer is frequently “more than anyone intended”. Retries need exponential backoff, jitter, a cap, and ideally only one layer that owns them.
What to say while it is happening
You will be asked for an update before you know the cause. Do not go quiet, and do not speculate publicly.
What works: what is affected and what is not, roughly how many users, whether any data is at risk, whether there is a workaround, and when you will next update. Then hit that time even if the answer is “still investigating”. A team that updates every twenty minutes reads as in control. A team that goes silent for an hour reads as lost, even if it is making faster progress.
After it is fixed, ask the better question
Not “what caused this?” — you know that now. Ask:
Why did a user find this before we did?
Almost every incident answers that the same way: the signal existed but nobody was watching it. The p99 had been climbing for a week. Throttles had been non-zero for days. The vendor had been getting slower since the last release.
The genuinely useful output of an incident is not the fix. It is the alert that means next time the dashboard tells you before support does.